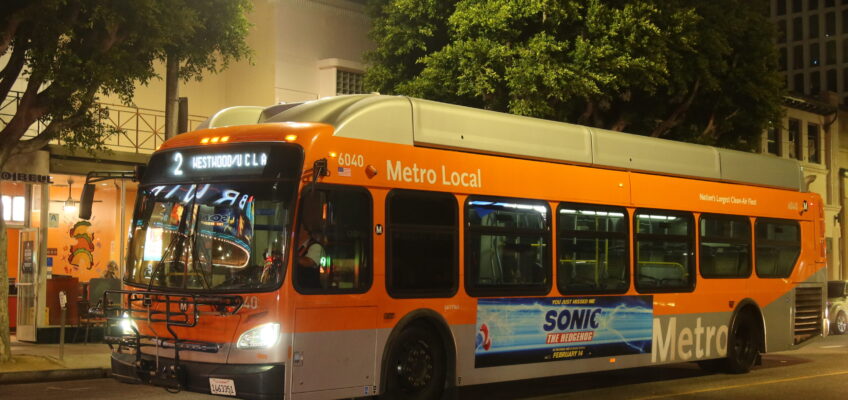
It is one of the most unusually shaped streets in the United States: straight in the middle but squiggly on either end. But Los Angeles’ 22-mile Sunset Boulevard is more than just a geographical oddity; it is a microcosm of America. Starting from Olvera Street, the birthplace of this nation’s second-largest city, it passes the home of baseball’s 2020 World Champions, rapidly-gentrifying Silver Lake, the grit and glamor of Hollywood, the rainbow flags of proud West Hollywood, the heart of Beverly Hills 90210, the renowned institution of UCLA, and posh Brentwood before finally winding its way down to the beaches of Pacific Palisades. Along the way, it goes by mansions and homeless tents, some of the country’s richest and poorest neighborhoods, and people representing the planet’s diversity.
Sunset Blvd. also gives us a fascinating glimpse into transit equity and the network effect. For decades, LA Metro operated the 2 Sunset bus along the boulevard’s entirety from the ocean to Downtown LA. A 2½ hour journey at rush hours, the route was so long that Metro split it into two segments a few years ago to improve reliability.
Transit Propensity
At first glance, it is surprising that buses run along the entire length of Sunset Blvd. at all. In the transit industry, “transit propensity” indices score places that are lower income, higher density and greater street connectivity higher than ones with acre-sized lots, winding streets and high incomes. These transit propensity indices are then frequently used to justify eliminating bus service in those areas that score low. Transit propensity is often viewed through the lens of equity – that as public entities, transit systems should devote more resources to communities that are the most disadvantaged.
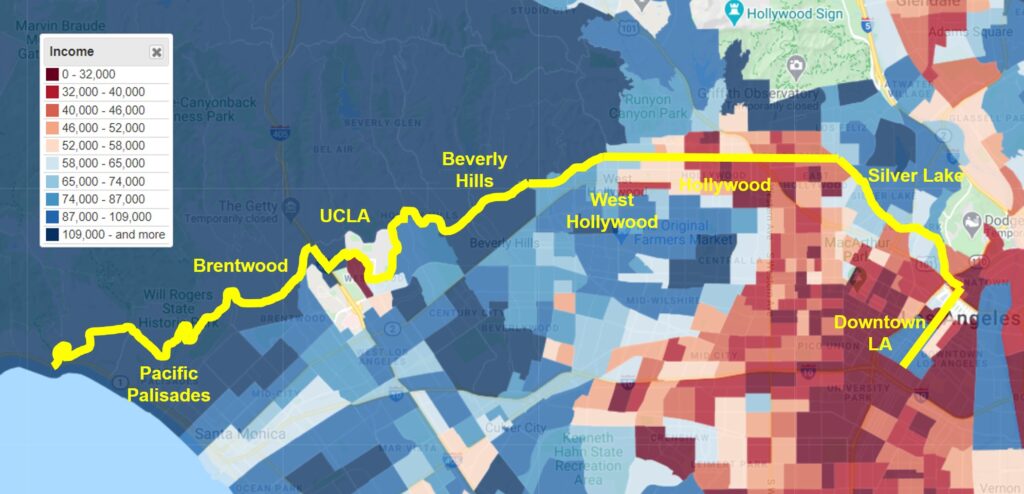
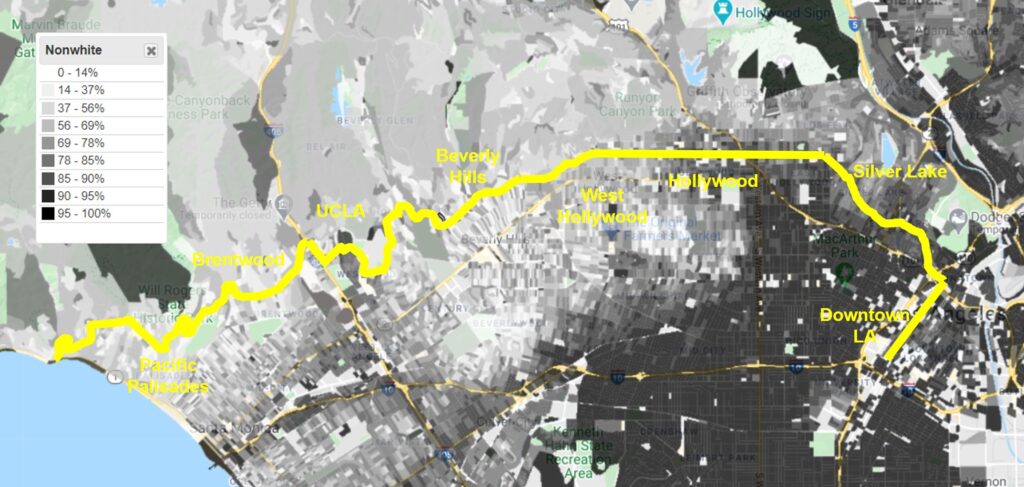
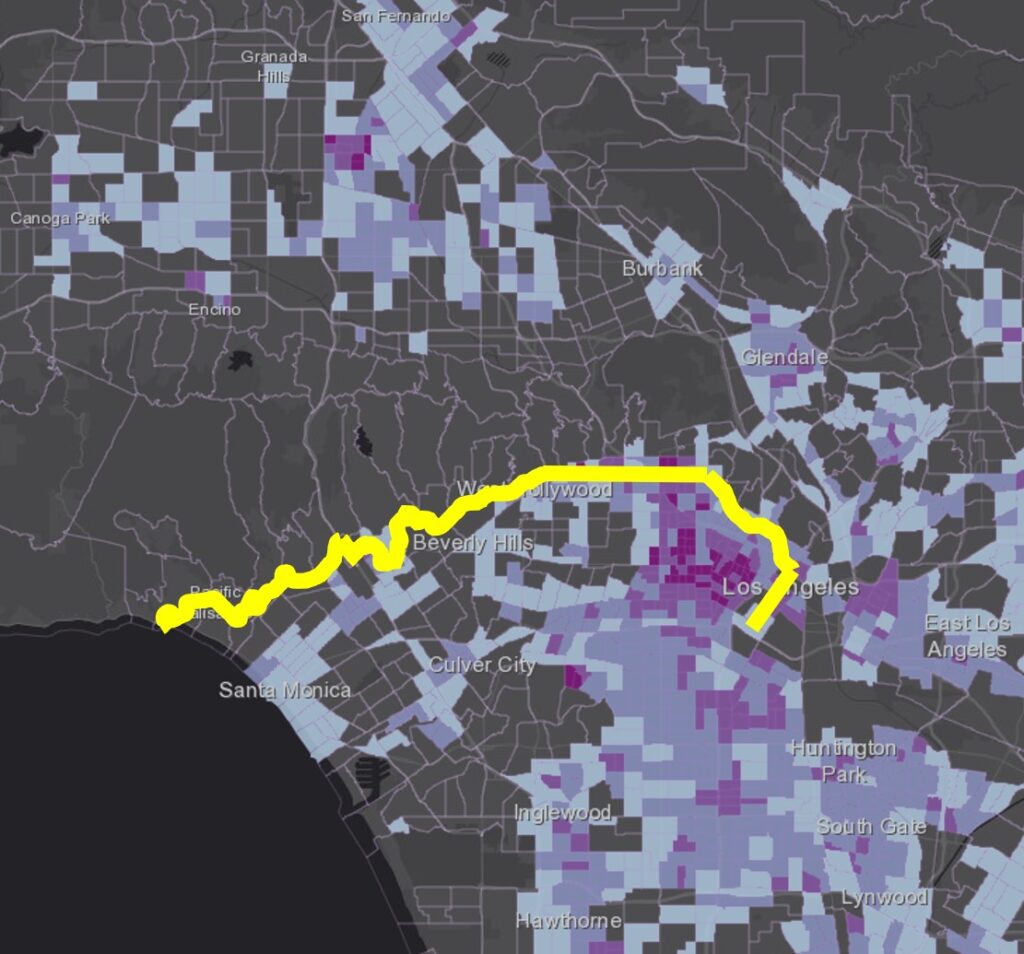
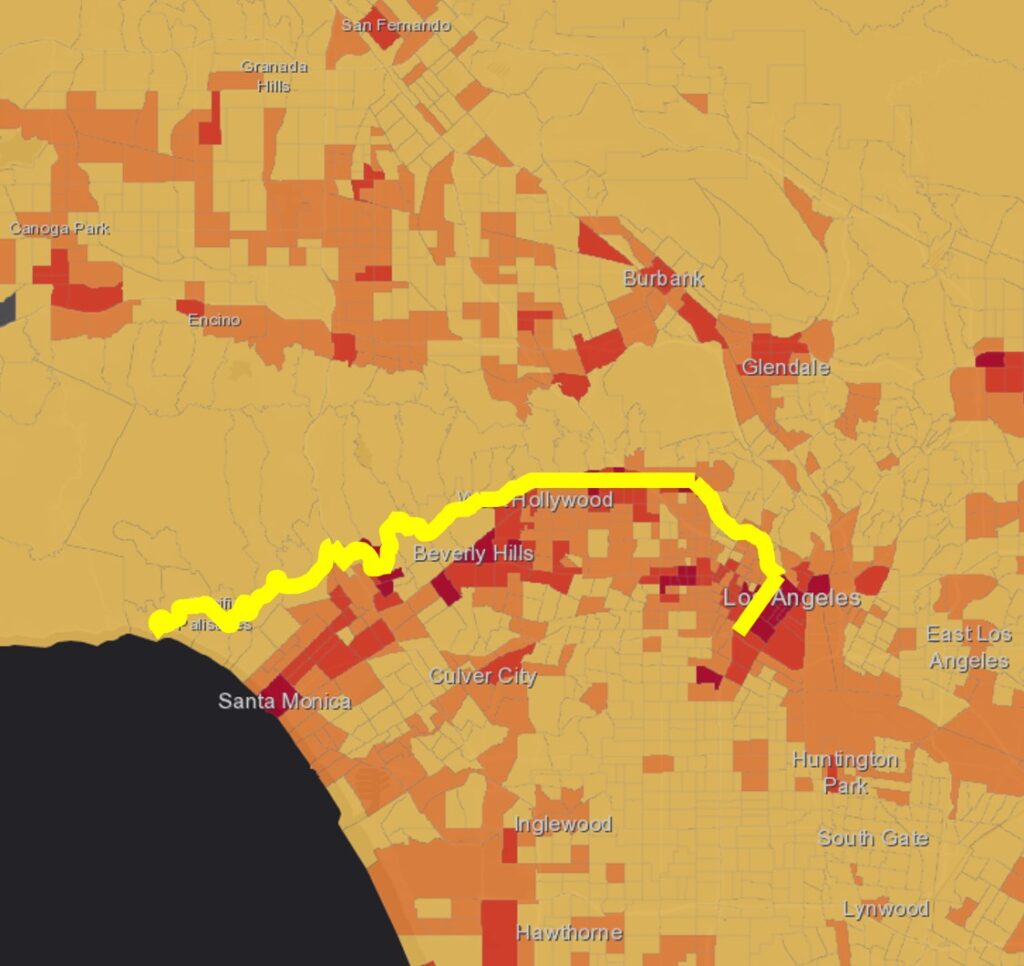
These maps show what the Sunset bus looks like superimposed on top of average household incomes and ethnicities. Unlike the inner eastern portion of the route, the outer western portion serves neighborhoods that are disproportionately high-income and White. With the exception of UCLA, the segment between Pacific Palisades and Beverly Hills sports some of America’s most expensive real estate and highest incomes, with palatial estates behind gates and manicured lawns. Due to hilly topography, streets meander. By traditional transit planning metrics, this certainly seems like a lost cause for transit.
Super Commutes
Prior to the 2017 service change that split the route into two, I had a chance to ride the 2 Sunset bus all the way from the ocean to downtown one afternoon. Leaving Pacific Palisades, the bus started to pick up people at seemingly random stops as it negotiated the road’s curves. Many of the riders knew each other and they graciously welcomed me into their conversation. It went something like this:
Me: “Discúlpeme. Buenas tardes. ¿Siempre toman ustedes este autobús?”
Fellow Transit Riders: “Sí, tres o cuatro días por semana para limpiar casas.” “Yo también. Soy jardinero.” “Y yo soy niñera.”
Me: “¿Cuánto tiempo duran sus viajes? ¿Hay que cambiar autobuses?”
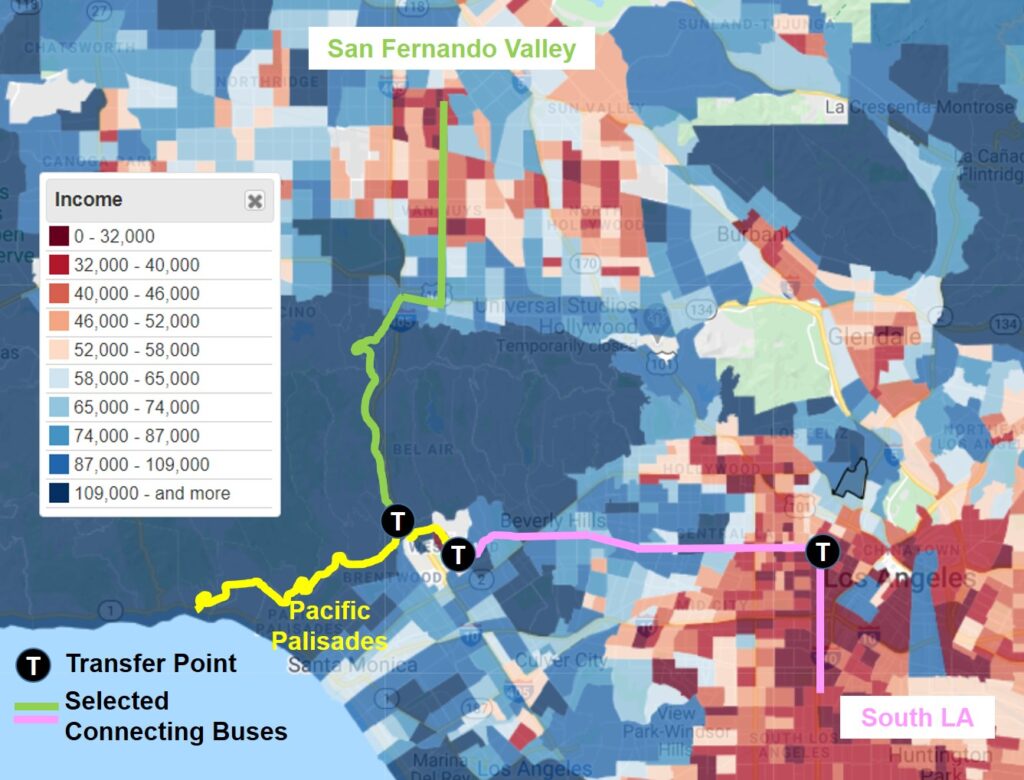
Fellow Transit Rider: “Dos horas. Tomamos la 2 a la universidad, y después transbordamos a la 761 a la Valle.”
Me: “¿A la Valle de San Fernando? ¿Vale la pena viajar tan lejos?””
Fellow Transit Rider: “Sí. No es difícil de encontrar trabajo.”
What I learned from my fellow riders was that they held a variety of housekeeping, landscaping and child care jobs and had no trouble finding work. They were on the first leg of a two-hour journey home, starting in Pacific Palisades and transferring at UCLA to another bus that would take them over the Santa Monica Mountains and back to the San Fernando Valley. They were headed to neighborhoods like Panorama City, a formerly racially-exclusionary postwar suburb centered around an automobile assembly plan. It is now home to thousands of working-class immigrants who take buses all over Los Angeles for jobs.
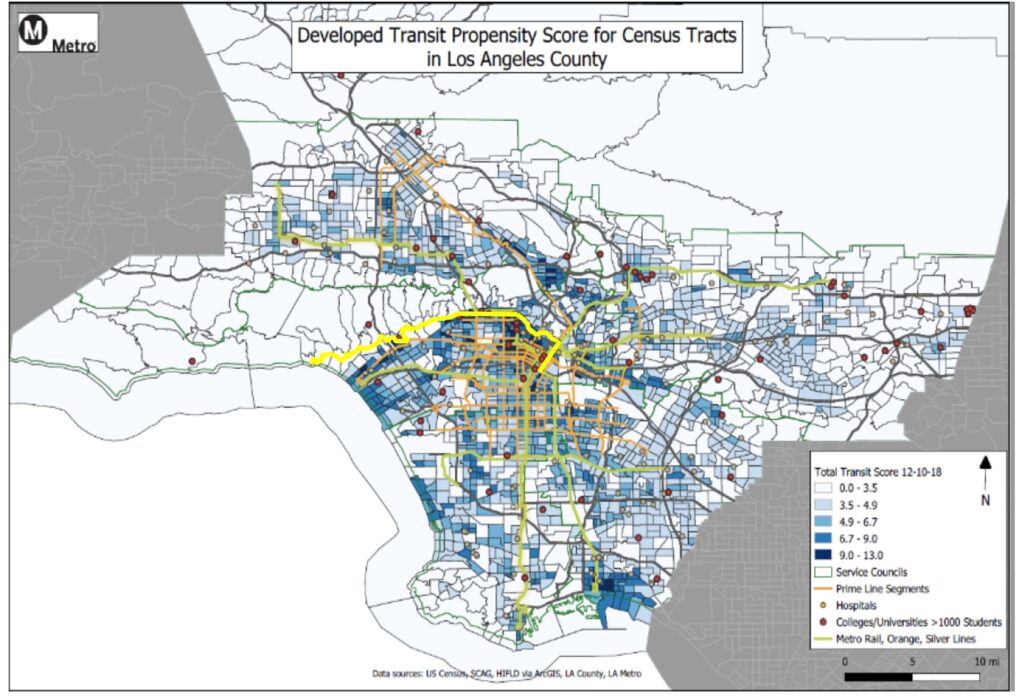
Even sophisticated transit models have difficulty picking up the travel patterns of these super commuters. They may correctly identify their homes as being in high transit propensity neighborhoods, but their travel needs may go undetected because their worksites are scattered in high-income, low-density areas with poor street connectivity. Indeed, LA Metro ranks portions of Pacific Palisades, Brentwood and Beverly Hills through which the Sunset bus passes in the lowest of five tiers of transit propensity.
A Lifeline Connecting Distinct Worlds
Sunset Blvd. reflects America’s long and difficult history of race, class, immigration, segregation and wealth inequality. However uncomfortable it is to discuss these issues, the reality is that for these riders, the Sunset bus is a lifeline to a dignified job that supports them and their families as they seek a better life in this country.
In fact, LA Metro used to run another bus on outer Sunset Blvd., the 576. It directly connected South Los Angeles to Beverly Hills, Brentwood and the Pacific Palisades. In a July 4, 2000 article entitled “Crosstown Bus Links 2 Worlds”, the Los Angeles Times noted that this bus started in the wake of the 1965 Watts Riots. A blue-ribbon panel had found insufficient transit “restricts, handicaps, isolates, frustrates and compounds the problems facing the poor” and identified “several hundred women” who faced hours and numerous transfers commuting to perform domestic work.
Foreshadowing the 576’s discontinuation in 2004, however, LA Metro’s scheduling director told the Times, “It is holding its own, sort of. It’s not the most productive line in the system.” Even when the bus got full, there was minimal seat turnover to boost ridership numbers. Further, the special route overlapped the 2 and other routes, so it was cancelled “due to excessive service duplication.” Taking transit was still be possible without this route, but required multiple buses.
Aside from the fact that there are residents who need transit even in the some of the most automobile-dependent areas – including students, seniors and people with disabilities – current and prospective transit riders are not necessarily the same people who live in the communities along a route. Planners and policymakers cannot fully anticipate transit demand or understand who needs transit simply by looking at a map and applying some formula or ridership recipe. In fact, a Social Equity Map specifically designed to highlight equity-focused areas is unable to identify where people living in these areas need to travel.
Increasing Transit Access Increases Equity
Clearly, we must redouble efforts to increase services and jobs in disadvantaged communities and in more centralized locations. Yet we must also acknowledge reality. Because of this country’s long history of ethnic and income segregation, disadvantaged populations often must travel far outside their neighborhoods for work, school and health care. Unlike the traditional 9-to-5 office job in a central business district that is relatively easy for transit to serve, this travel demand is often at odd hours at dispersed locations throughout a region. “Working from home” is simply not an option for caregivers, medical assistants, fulfillment associates, sales clerks, hotel maintenance staff, convenience store managers, security guards, cleaners and many others. These essential jobs are typically scattered throughout a metropolitan area, often near highways with poor transit access.
In some regions, gentrification and rising housing costs have also resulted in the displacement of low-income households from central cores to outlying areas. This “suburbanization of poverty” is pushing people to communities designed more around moving cars than for moving people. This results in both housing and job sprawl that is especially challenging for transit to serve when “transit deserts” are growing due to service reductions and reallocations. And no, when we are fighting a climate emergency, grappling with traffic congestion and limited space for parking, and already subsidizing car travel, it is not better to expend public funds to help buy a private car for everyone.
Increasing transit access increases equity. To truly serve equity needs, the transit industry cannot afford to write off low transit propensity areas, even if it costs more money or does not seem “productive” using a metric like boardings per hour. Operating throughout the day and evening and providing basic access throughout a region so that a person can travel from anywhere to anywhere in a reasonable amount of time helps everyone, but particularly the most disadvantaged.
The Network Effect
A comprehensive transit network also helps ridership. Being unable to take transit for even one segment of a trip means that systemwide ridership underperforms, including in a well-served, high transit propensity area.
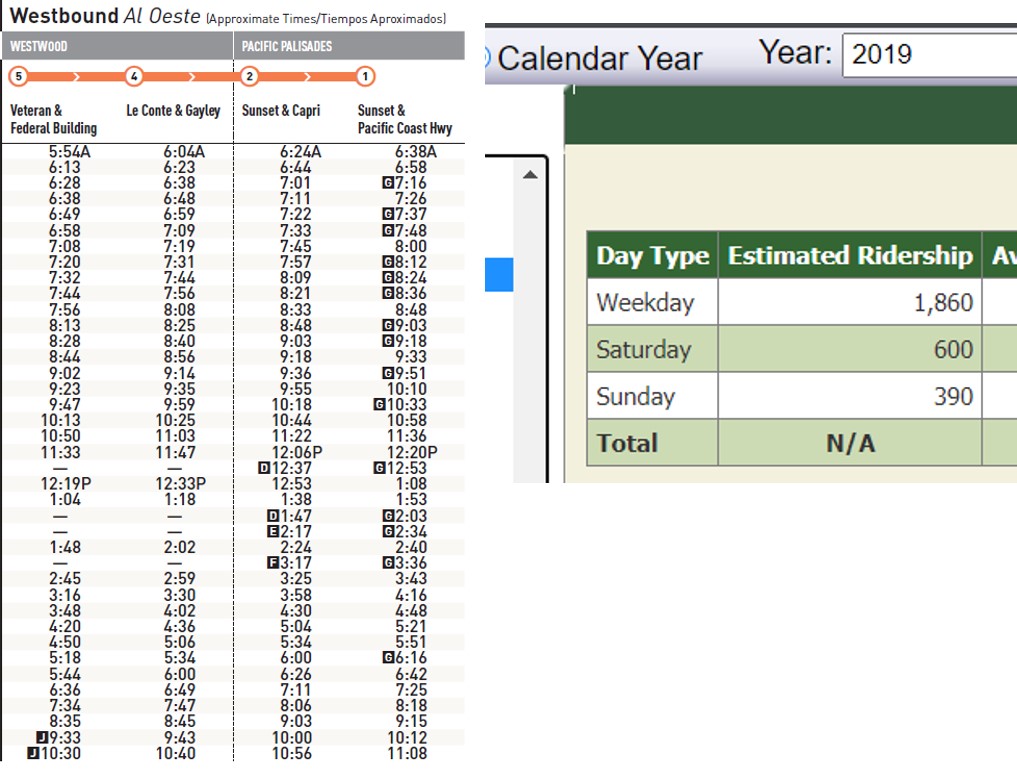
At most times, the bus on outer Sunset Blvd. offers basic service to provide general mobility. Prior to the pandemic, buses came every 30-45 minutes during the day and every 60 minutes in the evening. Yet looking at equity, employment, population density and other demographic maps, who would expect a mini-rush in the morning with buses headed to the ocean every 10-15 minutes? Or that the route would serve 1,860 trips on an average weekday?
Without the bus on outer Sunset Blvd., these workers would not be taking connecting bus routes either, including some of the busiest in the country. Those busy routes would then become less busy, thereby justifying service cuts and less frequency, which hurts everyone else. It is the classic “Network Effect,” where increased usage of a product by any user increases the value of the product for other users. Unfortunately, the Network Effect often goes undetected because transit data collection and service analyses typically focus on individual route performance.
A transit network is only as strong as its weakest link. This does not mean that all areas must have uniform levels of service; demand for local transit trips is still likely to be higher where incomes and automobile ownership are lower. However, limiting robust frequency and long hours of operation to only equity-focused or high transit propensity neighborhoods while not providing other areas with reasonable levels of service may have unintended consequences. While disadvantaged populations may be able to access transit near their homes, they may not be able to reach their destinations. In essence, this approach denies them access to part of their region’s opportunities, which may result in a lost job or forgone education. That would be an inequitable outcome.
A microcosm of America, Sunset Blvd. indeed teaches us a lot about what we must do to make transit systems great.
